This economic security fact sheet includes an analysis of current data on poverty in
Quick Facts on Poverty in Canada
Approximately 3.5 million Canadians were living in poverty in 2004 - more than 11% of the population.
The proportion of Canadian families living in poverty declined slightly, from 8.5% in 2003 to 7.8% in 2004. In all, 684,000 economic families were living below the poverty line in 2004.
Rates of poverty in 2004 were lowest among elderly families (2.1%) and highest among female lone-parent families (35.6%).
865,000 Canadian children under the age of 18 lived in poverty in 2004 – one of every eight children.
Canada:
Quick Facts
Measuring Poverty: LICO and MBM measures
Individual, Family and Child Poverty
Depth and Duration of Poverty
Other economic security fact sheets examine incomes for different family types and levels of geography, as well as expenditure patterns among Canadian households, with a focus on food security and housing affordability.
Measuring Poverty
LICO
Low income cut-offs (LICOs) - more commonly known as Canada's 'unofficial' poverty lines - are established by Statistics Canada using data from the Family Expenditure Survey (now known as the Survey of Household Spending). LICOs indicate the level of income at which a family may be in “straitened circumstances” because it spends a greater proportion of its income - 20 percentage points more - on necessities of food, shelter and clothing than does the average family of a similar size.
Separate cut-offs are determined for seven sizes of family - from unattached individuals to families of seven or more persons – and for five sizes of communities – from rural areas to urban areas with a population of 500,000+. (See table below)
Statistics Canada does not refer to the LICOs as poverty lines, although they concede that LICOs identify “those who are substantially worse off than the average.” And in the absence of official poverty lines, the
LICOs are used by many analysts to study the economic security of Canadian families and report on
important trends over time.
Source: Statistics Canada, Low Income Cut-offs for 2005 and Low Income Measures for 2004, Cat. 75F0002MIE.
Welfare Incomes
In Canada, social assistance or welfare is the safety net of last resort. It provides money to meet the basic needs of families and individuals who have exhausted all other means of financial support. Each province maintains its own welfare system, with rules to regulate eligibility for benefits, rates of assistance, and the amount of other income that recipients are allowed to keep.
The National Council of Welfare tracks information on social assistance. Drawing on their important work, below we present information on welfare incomes for four typical household types: a single person, a single person with a disability, a lone-parent family with a 2-year-old child, and a couple with two children aged 10 to 15.
Nearly 1.7 million Canadians - 5% of the population - relied on welfare in 2005, including almost half a million children.
In 2005, annual welfare income for a single employable person was lowest in New Brunswick ($3,201) and highest in Newfoundland/Labrador ($7,189). Between 2004 and 2005, welfare benefits for single employable individuals went down in most provinces. Saskatchewan reported an increase of 4.4%, and rates in Nova Scotia and Manitoba remained constant.
For couples with two children, annual welfare incomes were again lowest in New Brunswick ($17,567) and highest in Prince Edward Island ($21,213). The largest gains in 2005, across all households, were among couples with two children in Quebec, where welfare benefits rose by 10% over the previous year.
Among lone-parent families with one child, welfare incomes were generally down in 2005. The only exceptions were in Quebec, which reported a 5% increase, and in Saskatchewan, with a gain of 1.9%.
British Columbia was the only province in 2005 to increase welfare incomes for people with disabilities. Between 2004 and 2005, welfare benefits for this group rose by 6.3%.
Market Basket Measure (MBM)
The Market Basket Measure (MBM) of poverty was developed to complement existing measures such as the LICOs. The MBM is based on average household expenditures and is calculated by costing a basket of goods and services - including food, shelter, clothing and transportation - in several communities. Thresholds are then determined to represent the level of income needed by households to cover the costs of these basic goods and services. Both the MBM and the LICO are useful tools for assessing low income, and used in combination, they provide a detailed portrait of low income in Canada.
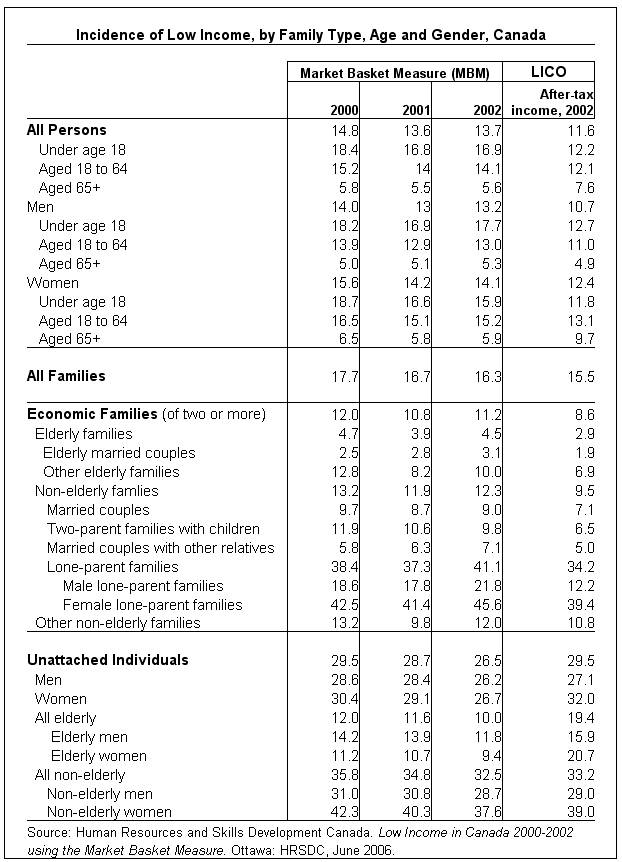
In 2002, the most recent year for which MBM data are available, the poverty rate in Canada was 13.7% - 2.1 percentage points higher then the poverty rate derived using after-tax LICOs.
Between 2000 and 2002, the incidence of low income dropped from 14.8% to 13.7%, according to the MBM. (Using Statistics Canadas after-tax LICO, the overall low-income rate dropped from 12.5% to 11.6%.)
Between 2000 and 2002, the rate of low income among children dropped from 18.4% to 16.9%. Among seniors, the low-income rate dropped slightly, from 5.8% to 5.6%.
Among all families, the low-income rate fell from 17.7% in 2000 to 16.3% in 2002, using the MBM. However, the rate among lone-parent families rose from 38.4% to 41.1%, and among female lone-parent families it increased from 42.5% to 45.6% over that period.
Incidence of Low Income, by Family Type, Age and Gender, Canada
Market Basket Measure (MBM) (%)
LICO (%)
2000
2001
2002
After-tax income, 2002
All Persons
14.8
13.6
13.7
11.6
Under age 18
18.4
16.8
16.9
12.2
Aged 18-64
15.2
14.0
14.1
12.1
Aged 65+
5.8
5.5
5.6
7.6
Men
14.0
13.0
13.2
10.7
Under age 18
18.2
16.9
17.7
12.7
Aged 18-64
13.9
12.9
13.0
11.0
Aged 65+
5.0
5.1
5.3
4.9
Women
15.6
14.2
14.1
12.4
Under age 18
18.7
16.6
15.9
11.8
Aged 18-64
16.5
15.1
15.2
13.1
Aged 65+
6.5
5.8
5.9
9.7
All Families
17.7
16.7
16.3
15.5
Economic Families (2 or more)
12.0
10.8
11.2
8.6
Elderly families
4.7
3.9
4.5
2.9
Elderly married couples
2.5
2.8
3.1
1.9
Other elderly families
12.8
8.2
10.0
6.9
Non-elderly families
13.2
11.9
12.3
9.5
Married couples
9.7
8.7
9.0
7.1
Two-parent families with children
11.9
10.6
9.8
6.5
Married couples with other relatives
5.8
6.3
7.1
5.0
Lone-parent families
38.4
37.3
41.1
34.2
Male lone-parent families
18.6
17.8
21.8
12.2
Female lone-parent families
42.5
41.4
45.6
39.4
Other non-elderly families
13.2
9.8
12.0
10.8
Unattached Individuals
29.5
28.7
26.5
29.5
Men
28.6
28.4
26.2
27.1
Women
30.4
29.1
26.7
32.0
All Elderly
12.0
11.6
10.0
19.4
Elderly Men
14.2
13.9
11.8
15.9
Elderly Women
11.2
10.7
9.4
20.7
All Non-elderly
35.8
34.8
32.5
33.2
Non-elderly men
31.0
30.8
28.7
29.0
Non-elderly women
42.3
40.3
37.6
39.0
Notes:An economic family is defined as a group of two or more persons who live in the same dwelling and are related to each other by blood, marriage, common law or adoption.
An unattached individual is a person who lives alone or with others to whom they are not related, such as a roommate or lodger.
Source: Human Resources and Skills Development Canada. Low Income in Canada 2000-2002 using the Market Basket Measure. Ottawa: HRSDC, June 2006
In the following section, low-income figures are calculated using after-tax LICOs. For information on poverty based on total income, see Statistics Canadas Income in Canada 2004, Cat. 75-202-XIE.
Individuals in Poverty
In 2004, 3.4 million Canadians were living in poverty - 11.2% of the total population. Poverty rates were highest among children and youth under the age of 18 (at 12.8%) and lowest among seniors over age 65 (at 5.6%).
Provincially, poverty rates for individuals were highest in British Columbia (14.2%) in 2004, and lowest in Prince Edward Island (6%).
For people under age 18, poverty rates were highest in British Columbia (18.1%) and lowest in Prince Edward Island (4.6%).
Among individuals of working age (18 to 64 years), poverty rates were again highest in British Columbia (14.3%) and lowest in Prince Edward Island (6.9%).
Among Canadas seniors (aged 65+), poverty rates in 2004 were lowest in Saskatchewan (1.9%) and highest in Quebec (9.3%).
Percentage of Persons Living in Low Income,* by Age Group,
Canada and the Provinces, 2000-2004
2000
2001
2002
2003
2004
Canada
All persons
12.5
11.2
11.6
11.6
11.2
Under age 18
13.8
12.1
12.2
12.5
12.8
Aged 18-64
12.9
11.7
12.1
12.2
11.7
Aged 65+
7.6
6.7
7.6
6.8
5.6
Nfld/Lab
All persons
13.2
11.1
11.4
12.2
12.2
Under age 18
17.7
13.7
14.0
15.8
16.7
Aged 18-64
13.4
11.6
12.2
13.0
12.7
Aged 65+
3.6
3.4
2.2
2.1
2.3
PEI
All persons
9.1
7.5
7.3
6.5
6.0
Under age 18
7.7
5.8
7.1
4.7
4.6
Aged 18-64
10.2
8.9
7.8
7.6
6.9
Aged 65+
5.9
3.7
5.8
4.5
4.0
NS
All persons
11.6
10.6
9.9
11.2
9.9
Under age 18
12.5
13.3
12.7
14.4
11.9
Aged 18-64
12.5
11.2
10.2
11.5
10.5
Aged 65+
5.7
3.0
4.1
5.1
4.2
NB
All persons
9.2
8.7
9.7
9.7
8.3
Under age 18
10.5
9.5
10.3
10.9
8.8
Aged 18-64
9.8
9.7
10.9
10.6
9.4
Aged 65+
3.4
2.3
2.9
2.9
2.7
QC
All persons
14.8
13.8
12.3
12.3
11.2
Under age 18
16.0
14.5
11.3
10.9
10.9
Aged 18-64
14.9
14.1
12.6
13.1
11.7
Aged 65+
12.1
10.6
11.8
10.3
9.3
ON
All persons
10.8
9.3
10.7
10.4
10.6
Under age 18
12.8
10.3
11.7
11.4
12.8
Aged 18-64
11.0
9.6
11.2
11.1
11.1
Aged 65+
6.1
5.2
5.6
4.9
3.8
MB
All persons
13.4
11.5
12.2
12.6
11.1
Under age 18
16.7
15.6
16.2
16.9
12.8
Aged 18-64
13.0
10.6
11.3
12.0
11.4
Aged 65+
9.4
8.7
9.1
8.1
6.7
SK
All persons
10.9
9.7
8.6
9.8
10.1
Under age 18
13.0
10.7
8.9
12.9
10.9
Aged 18-64
12.0
10.9
9.9
10.4
11.7
Aged 65+
2.5
2.8
3.0
1.8
1.9
AB
All persons
11.1
10.0
9.3
10.7
10.5
Under age 18
12.3
10.9
9.2
11.0
11.7
Aged 18-64
11.9
10.7
10.3
11.7
11.3
Aged 65+
2.4
2.2
2.3
3.5
2.5
BC
All persons
15.1
14.1
16.0
15.3
14.2
Under age 18
14.1
14.0
18.3
18.7
18.1
Aged 18-64
16.5
15.1
16.1
15.2
14.3
Aged 65+
9.6
9.1
11.7
10.4
8.0
*After-tax LICOs, 1992 base
Source: Statistics Canada. Income Trends in Canada 2004, Cat. 75-202-XIE.
Number and Per cent of Persons in Low Income,*
Canada, 2000 to 2004
2000
2001
2002
2003
2004
% Change
2000 to 2004
Per cent
12.5
11.2
11.6
11.6
11.2
Number
3,741,000
3,394,000
3,536,000
3,587,000
3,479,000
-7.0%
*After-tax LICOs, 1992 base.
Source: Statistics Canada, Income Trends in Canada 2004, Cat. 75-202-XIE.
Families in Poverty
In 2004, 7.8% of all Canadian families were living in poverty. This figure was down from 9% in 2000.
Families in British Columbia reported the highest poverty rates in 2004, with 10.3% living below the LICO. Family poverty rates were lowest in Prince Edward Island, at 3.2%.
Canadas elderly families had the lowest poverty rates in 2004 (2.1%), but single seniors did not fare as well. In particular, elderly women living on their own had high rates of poverty - 17% in 2004 - while 11.6% of elderly men were poor.
Across the country, elderly families in Quebec and Manitoba had the highest poverty rates in 2004 3.4% and 3.5% respectively while elderly families in Saskatchewan had the lowest rate, at 0.5%.
[Click on tabs below to view provincial data.]
Canada
Nfld/Lab
PEI
NS
NB
Que
Ont
Man
Sask
Alta
BC
CANADA, Per cent of Families in Low Income, 2000 to 2004
2000
2001
2002
2003
2004
Economic Families of two or more persons
9.0
7.9
8.6
8.5
7.8
Elderly Families
3.1
2.5
2.9
2.7
2.1
Non-elderly Families
10.0
8.8
9.5
9.5
8.8
Married couples without children
6.9
6.4
7.1
6.6
6.2
Two-parent families with children
8.3
6.9
6.5
6.7
6.7
Lone-parent families
32.3
30.1
34.2
34.0
31.7
Male lone-parent families
12.3
12.3
12.2
12.8
14.2
Female lone-parent families
36.3
33.8
39.4
38.8
35.6
Unattached Individuals
32.9
30.8
29.5
29.6
29.6
Elderly men
17.6
16.8
15.9
14.7
11.6
Elderly women
21.6
18.6
20.7
18.9
17.0
Non-elderly men
32.1
30.3
29.0
30.7
31.5
Non-elderly women
44.3
42.1
39.0
38.0
38.4
Notes: F indicates that data cannot be released due to small sample size.
Low-income figures are calculated using after-tax LICOs, 1992 base.
An economic family is defined as a group of two or more persons who live in the same dwelling and are related to each other by blood, marriage, common law or adoption.
An unattached individual is a person who lives alone or with others to whom they are not related, such as a roommate or lodger.
Source: Statistics Canada. Income Trends in Canada 2004. Cat. 75-202-XIE.
NEWFOUNDLAND AND LABRADOR, Per Cent of Families in Low Income, 2000 to 2004
2000
2001
2002
2003
2004
Economic Families of two or more persons
11.0
9.0
8.5
9.2
9.2
Elderly Families
2.3
1.0
1.3
F
1.4
Non-elderly Families
12.5
10.3
9.8
10.7
10.5
Married couples without children
11.2
10.3
8.9
7.8
9.5
Two-parent families with children
10.2
7.7
7.3
7.9
9.5
Lone-parent families
41.1
32.1
38.0
44.3
33.5
Male lone-parent families
F
F
F
F
F
Female lone-parent families
43.3
33.5
40.7
48.0
38.4
Unattached Individuals
33.2
32.2
38.4
39.4
35.9
Elderly men
F
F
F
F
F
Elderly women
15.3
13.9
9.3
F
F
Non-elderly men
38.8
41.6
47.0
51.0
41.8
Non-elderly women
49.9
42.4
53.5
55.5
57.5
Notes: F indicates that data cannot be released due to small sample size.
Low-income figures are calculated using after-tax LICOs, 1992 base.
An economic family is defined as a group of two or more persons who live in the same dwelling and are related to each other by blood, marriage, common law or adoption.
An unattached individual is a person who lives alone or with others to whom they are not related, such as a roommate or lodger.
Source: Statistics Canada. Income Trends in Canada 2004. Cat. 75-202-XIE.
PRINCE EDWARD ISLAND, Per cent of Families in Low Income, 2000 to 2004
2000
2001
2002
2003
2004
Economic Families of two or more persons
7.0
5.7
5.0
3.6
3.2
Elderly Families
7.4
5.4
F
F
F
Non-elderly Families
6.9
5.8
5.2
3.3
3.8
Married couples without children
9.2
7.8
5.4
3.0
2.7
Two-parent families with children
4.5
3.5
4.2
3.8
2.1
Lone-parent families
22.2
19.4
17.6
F
15.4
Male lone-parent families
F
F
F
F
F
Female lone-parent families
25.5
20.4
18.2
F
13.8
Unattached Individuals
29.8
24.6
27.2
28.8
27.1
Elderly men
F
F
F
F
F
Elderly women
13.2
7.8
13.3
10.0
13.6
Non-elderly men
30.8
26.9
32.5
39.4
34.6
Non-elderly women
49.9
41.4
36.9
40.8
37.0
Notes: F indicates that data cannot be released due to small sample size.
Low-income figures are calculated using after-tax LICOs, 1992 base.
An economic family is defined as a group of two or more persons who live in the same dwelling and are related to each other by blood, marriage, common law or adoption.
An unattached individual is a person who lives alone or with others to whom they are not related, such as a roommate or lodger.
Source: Statistics Canada. Income Trends in Canada 2004. Cat. 75-202-XIE.
NOVA SCOTIA, Per cent of Families in Low Income, 2000 to 2004
2000
2001
2002
2003
2004
Economic Families of two or more persons
8.8
7.6
7.5
8.6
6.4
Elderly Families
3.4
1.9
2.3
1.9
1.7
Non-elderly Families
9.8
8.7
8.5
10.0
7.4
Married couples without children
10.1
8.5
4.1
6.9
4.2
Two-parent families with children
7.6
7.2
5.5
8.0
6.2
Lone-parent families
29.7
30.9
38.6
38.2
27.4
Male lone-parent families
F
F
F
F
F
Female lone-parent families
31.2
32.5
35.0
38.2
27.8
Unattached Individuals
31.2
28.1
26.4
27.3
30.2
Elderly men
12.1
F
F
15.5
F
Elderly women
14.2
6.5
10.5
12.3
10.9
Non-elderly men
35.2
34.8
32.3
30.8
36.5
Non-elderly women
42.9
41.2
35.6
36.4
38.5
Notes: F indicates that data cannot be released due to small sample size.
Low-income figures are calculated using after-tax LICOs, 1992 base.
An economic family is defined as a group of two or more persons who live in the same dwelling and are related to each other by blood, marriage, common law or adoption.
An unattached individual is a person who lives alone or with others to whom they are not related, such as a roommate or lodger.
Source: Statistics Canada. Income Trends in Canada 2004. Cat. 75-202-XIE.
NEW BRUNSWICK, Per cent of Families in Low Income, 2000 to 2004
2000
2001
2002
2003
2004
Economic Families of two or more persons
6.8
7.0
7.9
8.2
6.7
Elderly Families
0.6
0.6
1.0
1.6
1.2
Non-elderly Families
7.9
8.1
9.1
9.3
7.7
Married couples without children
6.1
6.8
8.1
7.8
7.6
Two-parent families with children
6.2
3.3
5.8
5.5
4.3
Lone-parent families
33.2
41.4
34.1
39.0
31.2
Male lone-parent families
F
F
F
F
F
Female lone-parent families
38.4
44.0
38.2
44.9
34.8
Unattached Individuals
28.6
27.2
26.1
23.7
24.3
Elderly men
F
F
F
7.8
F
Elderly women
11.2
7.2
8.5
4.8
6.2
Non-elderly men
34.8
34.6
34.6
30.9
30.5
Non-elderly women
42.1
42.9
38.0
37.9
37.0
Notes: F indicates that data cannot be released due to small sample size.
Low-income figures are calculated using after-tax LICOs, 1992 base.
An economic family is defined as a group of two or more persons who live in the same dwelling and are related to each other by blood, marriage, common law or adoption.
An unattached individual is a person who lives alone or with others to whom they are not related, such as a roommate or lodger.
Source: Statistics Canada. Income Trends in Canada 2004. Cat. 75-202-XIE.
QUEBEC, Per cent of Families in Low Income, 2000 to 2004
2000
2001
2002
2003
2004
Economic Families of two or more persons
10.5
9.4
9.0
8.7
7.3
Elderly Families
3.7
2.7
4.9
2.7
3.4
Non-elderly Families
11.6
10.5
9.7
9.6
7.9
Married couples without children
8.4
8.0
8.3
7.4
6.1
Two-parent families with children
8.8
8.6
5.3
5.8
5.7
Lone-parent families
37.5
31.8
33.5
29.8
25.1
Male lone-parent families
20.1
11.7
10.0
8.9
14.1
Female lone-parent families
41.6
36.5
40.2
35.1
28.5
Unattached Individuals
37.8
35.5
31.3
31.4
30.6
Elderly men
19.3
21.4
17.4
15.3
12.4
Elderly women
37.5
32.6
32.7
31.0
28.3
Non-elderly men
34.1
30.4
25.9
30.2
32.7
Non-elderly women
45.9
46.2
40.0
36.4
33.0
Notes: F indicates that data cannot be released due to small sample size.
Low-income figures are calculated using after-tax LICOs, 1992 base.
An economic family is defined as a group of two or more persons who live in the same dwelling and are related to each other by blood, marriage, common law or adoption.
An unattached individual is a person who lives alone or with others to whom they are not related, such as a roommate or lodger.
Source: Statistics Canada. Income Trends in Canada 2004. Cat. 75-202-XIE.
ONTARIO, Per cent of Families in Low Income, 2000 to 2004
2000
2001
2002
2003
2004
Economic Families of two or more persons
7.8
6.6
8.1
7.8
7.7
Elderly Families
3.4
2.1
1.9
2.8
1.4
Non-elderly Families
8.5
7.4
9.1
8.6
8.8
Married couples without children
4.8
5.1
5.3
4.8
6.1
Two-parent families with children
7.8
6.2
6.6
6.2
6.8
Lone-parent families
28.1
26.4
34.9
33.0
33.1
Male lone-parent families
4.9
9.1
11.3
7.9
14.3
Female lone-parent families
32.6
29.7
39.7
37.7
36.6
Unattached Individuals
30.1
27.9
27.7
27.9
28.8
Elderly men
18.0
14.4
16.0
14.4
9.0
Elderly women
16.6
14.8
15.5
13.6
11.6
Non-elderly men
30.5
29.0
28.7
30.2
31.6
Non-elderly women
40.7
37.3
37.2
36.8
39.8
Notes: F indicates that data cannot be released due to small sample size.
Low-income figures are calculated using after-tax LICOs, 1992 base.
An economic family is defined as a group of two or more persons who live in the same dwelling and are related to each other by blood, marriage, common law or adoption.
An unattached individual is a person who lives alone or with others to whom they are not related, such as a roommate or lodger.
Source: Statistics Canada. Income Trends in Canada 2004. Cat. 75-202-XIE.
MANITOBA, Per Cent of Families in Low Income, 2000 to 2004
2000
2001
2002
2003
2004
Economic Families of two or more persons
9.6
7.9
8.5
8.7
8.0
Elderly Families
4.1
2.8
2.4
3.4
3.5
Non-elderly Families
10.6
8.8
9.7
9.6
8.8
Married couples without children
5.8
6.0
6.8
5.7
5.4
Two-parent families with children
8.1
6.2
8.8
9.5
7.5
Lone-parent families
40.6
38.2
35.7
33.4
29.7
Male lone-parent families
F
F
18.6
F
F
Female lone-parent families
43.8
41.1
39.0
36.7
34.7
Unattached Individuals
32.1
28.1
28.2
28.6
28.4
Elderly men
15.1
16.3
17.7
14.9
9.7
Elderly women
24.6
22.6
24.6
20.4
16.2
Non-elderly men
34.4
28.9
27.6
28.2
32.2
Non-elderly women
42.7
36.6
34.4
38.7
36.3
Notes: F indicates that data cannot be released due to small sample size.
Low-income figures are calculated using after-tax LICOs, 1992 base.
An economic family is defined as a group of two or more persons who live in the same dwelling and are related to each other by blood, marriage, common law or adoption.
An unattached individual is a person who lives alone or with others to whom they are not related, such as a roommate or lodger.
Source: Statistics Canada. Income Trends in Canada 2004. Cat. 75-202-XIE.
SASKATCHEWAN, Per Cent of Families in Low Income, 2000 to 2004
2000
2001
2002
2003
2004
Economic Families of two or more persons
8.5
6.8
5.8
7.0
7.0
Elderly Families
0.7
1.2
0.7
0.7
0.5
Non-elderly Families
10.2
8.1
6.9
8.3
8.3
Married couples without children
8.1
6.4
6.2
5.5
6.0
Two-parent families with children
6.0
5.4
3.0
5.4
5.7
Lone-parent families
38.9
26.1
28.3
33.4
29.5
Male lone-parent families
F
F
F
F
28.2
Female lone-parent families
42.1
29.1
32.4
37.2
29.7
Unattached Individuals
26.3
26.5
25.3
23.6
27.0
Elderly men
F
6.2
F
F
F
Elderly women
6.7
6.8
8.4
3.9
5.1
Non-elderly men
34.9
31.9
31.3
32.7
35.0
Non-elderly women
43.1
45.2
40.3
34.3
42.3
Notes: F indicates that data cannot be released due to small sample size.
Low-income figures are calculated using after-tax LICOs, 1992 base.
An economic family is defined as a group of two or more persons who live in the same dwelling and are related to each other by blood, marriage, common law or adoption.
An unattached individual is a person who lives alone or with others to whom they are not related, such as a roommate or lodger.
Source: Statistics Canada. Income Trends in Canada 2004. Cat. 75-202-XIE.
ALBERTA, Per Cent of Families in Low Income, 2000 to 2004
2000
2001
2002
2003
2004
Economic Families of two or more persons
7.3
6.8
5.8
7.1
7.0
Elderly Families
F
0.3
0.7
1.1
0.5
Non-elderly Families
8.3
7.6
6.5
7.9
7.9
Married couples without children
5.1
5.8
6.0
7.7
6.6
Two-parent families with children
7.8
6.4
5.5
6.0
5.7
Lone-parent families
28.5
26.1
22.9
30.7
29.8
Male lone-parent families
F
F
F
F
F
Female lone-parent families
32.8
31.0
28.5
37.1
37.5
Unattached Individuals
30.4
26.7
28.5
30.7
28.2
Elderly men
F
F
F
F
6.3
Elderly women
8.4
4.5
9.1
9.3
8.5
Non-elderly men
28.8
26.9
29.3
32.4
26.6
Non-elderly women
47.9
41.4
40.1
42.4
42.5
Notes: F indicates that data cannot be released due to small sample size.
Low-income figures are calculated using after-tax LICOs, 1992 base.
An economic family is defined as a group of two or more persons who live in the same dwelling and are related to each other by blood, marriage, common law or adoption.
An unattached individual is a person who lives alone or with others to whom they are not related, such as a roommate or lodger.
Source: Statistics Canada. Income Trends in Canada 2004. Cat. 75-202-XIE.
BRITISH COLUMBIA, Per Cent of Families in Low Income, 2000 to 2004
2000
2001
2002
2003
2004
Economic Families of two or more persons
11.3
10.3
12.5
11.7
10.3
Elderly Families
4.0
5.4
5.7
4.4
3.2
Non-elderly Families
12.5
11.1
13.6
13.0
11.6
Married couples without children
9.9
6.2
10.9
8.8
6.4
Two-parent families with children
10.2
7.3
10.1
10.1
9.3
Lone-parent families
29.8
35.2
41.2
45.1
45.6
Male lone-parent families
F
F
15.1
25.7
F
Female lone-parent families
33.3
38.8
46.6
49.9
49.1
Unattached Individuals
34.4
34.4
32.9
31.7
31.4
Elderly men
27.9
27.8
25.6
25.0
20.9
Elderly women
21.4
19.5
25.6
24.0
21.0
Non-elderly men
31.6
33.1
32.2
30.0
30.4
Non-elderly women
47.9
46.7
41.3
40.2
41.6
Notes: F indicates that data cannot be released due to small sample size.
Low-income figures are calculated using after-tax LICOs, 1992 base.
An economic family is defined as a group of two or more persons who live in the same dwelling and are related to each other by blood, marriage, common law or adoption.
An unattached individual is a person who lives alone or with others to whom they are not related, such as a roommate or lodger.
Source: Statistics Canada. Income Trends in Canada 2004. Cat. 75-202-XIE.
Lone-parent families also struggled with very high rates of poverty. In 2004, 31.7% were living in low income. Poverty rates among lone-parent families were highest in British Columbia (45.6%) and lowest in Prince Edward Island (15.4%).
Female-headed lone-parent families had much higher poverty rates than male-led lone-parent families - 35.6% compared to 14.2% in 2004. Between 2000 and 2004, poverty rates among all lone-parent families remained virtually unchanged, after making significant gains in the mid- to late-1990s when their poverty rate dropped from 45.0% to 32.3%.
While some provinces recorded minor fluctuations in poverty rates among lone-parent families between 2000 and 2004, rates for such families in British Columbia jumped from 29.8% to 45.6%.
Child Poverty
There were 865,000 Canadian children under age 18 living in poverty in 2004.
Between 2000 and 2004, the child poverty rate dropped by only one percentage point - from 13.8% to 12.8%. Child poverty rates went down in all provinces between 2000 and 2004, except in British Columbia, where the rate rose four percentage points.
In 2004, child poverty rates were highest in British Columbia (18.1%) and lowest in Prince Edward Island (4.6%).
Number and Per cent of Children under 18 Living in Poverty
Canada and the Provinces, 2000 to 2004
2000
2001
2002
2003
2004
No.
%
No.
%
No.
%
No.
%
No.
%
Canada
995,000
13.8
835,000
12.1
839,000
12.2
850,000
12.5
865,000
12.8
Newfoundland & Labrador
20,000
17.7
15,000
13.7
15,000
14.0
16,000
15.8
17,000
16.7
Prince Edward Island
*
7.7
*
5.8
*
7.1
*
4.7
*
4.6
Nova Scotia
25,000
12.5
26,000
13.3
25,000
12.7
27,000
14.4
22,000
11.9
New Brunswick
17,000
10.5
15,000
9.5
16,000
10.3
17,000
10.9
13,000
8.8
Quebec
251,000
16.0
225,000
14.5
173,000
11.3
166,000
10.9
165,000
10.9
Ontario
351,000
12.8
285,000
10.3
324,000
11.7
313,000
11.4
353,000
12.8
Manitoba
44,000
16.7
41,000
15.6
42,000
16.2
43,000
16.9
33,000
12.8
Saskatchewan
31,000
13.0
24,000
10.7
20,000
8.9
29,000
12.9
24,000
10.9
Alberta
91,000
12.3
81,000
10.9
68,000
9.2
80,000
11.0
86,000
11.7
British Columbia
123,000
14.1
121,000
14.0
155,000
18.3
157,000
18.7
151,000
18.1
Notes: Data calculated using after-tax LICOs, 1992 base.
*Number is too small to be released.
Source: Statistics Canada. Income Trends in Canada 2004, Cat. 75-202-XIE.
In 2004 in Canadas large urban centres (or census metropolitan areas), child poverty rates were highest in the CMAs of Vancouver (22.2%) and Winnipeg (17.7%). The lowest child poverty rate was reported in the CMA of St. Catharines-Niagara (7.2%).
Depth of Poverty
The low income gap represents the difference between the average income of a poor household and the appropriate Low Income Cut-off (LICO).
In 2004, the average low income gap among economic families was $7,200. In other words, it would require $7,200 to bring the average low-income family of two or more persons up to the poverty line. The low income gap among Canadas economic families remained relatively stable between 2000 and 2004, dropping by a modest $100.
Among the provinces, British Columbia had the largest low income gap in 2004, at $8,500. Newfoundland/Labrador reported the lowest average gap among economic families, at $4,800.
For unattached individuals, the average low income gap in 2004 was $6,100. As with economic families, the gap remained virtually unchanged between 2000 and 2004. British Columbia again reported the largest low income gap among unattached individuals in 2004, at $6,600.
Duration of Poverty
Between 1999 and 2004, approximately 4.5 million Canadians experienced poverty for at least one year.
Just under two million Canadians lived in poverty for one year over that period, and almost half a million lived in poverty for all six years.
Women were more likely than men to live in poverty for extended periods of time. Between 1999 and 2004, 2.5% of women lived in poverty for all six years, compared to 1.8% of men.
Among children, 121,000 lived in poverty each year over that period.
The Canadian Council on Social Development (CCSD) is Canada's oldest non-profit research group. The Council works with partners and our membership base across the country to measure, monitor and report on issues of social and economic security and well-being. A national, membership-based organization, the CCSD facilitates forums that encourage innovative and pro-active sharing, discussion and debate. For a wealth of information on issues related to Canada's social safety net, visit our website at www.ccsd.ca.This and other fact sheets are available for download free of charge on our Stats & Facts subsite at www.ccsd.ca/factsheets/.

